Three Hobbies, One Codebase: Building myphotolib
I take photos in the mountains. I hike with a Garmin on my wrist. I write software
for a living. For years those three things lived in three separate places: JPEGs in
Dropbox folders, .gpx files nobody ever opened, and a career’s worth of code that
had nothing to do with either.
This is the story of the three weeks I spent joining them, and of the things the data did to me along the way.
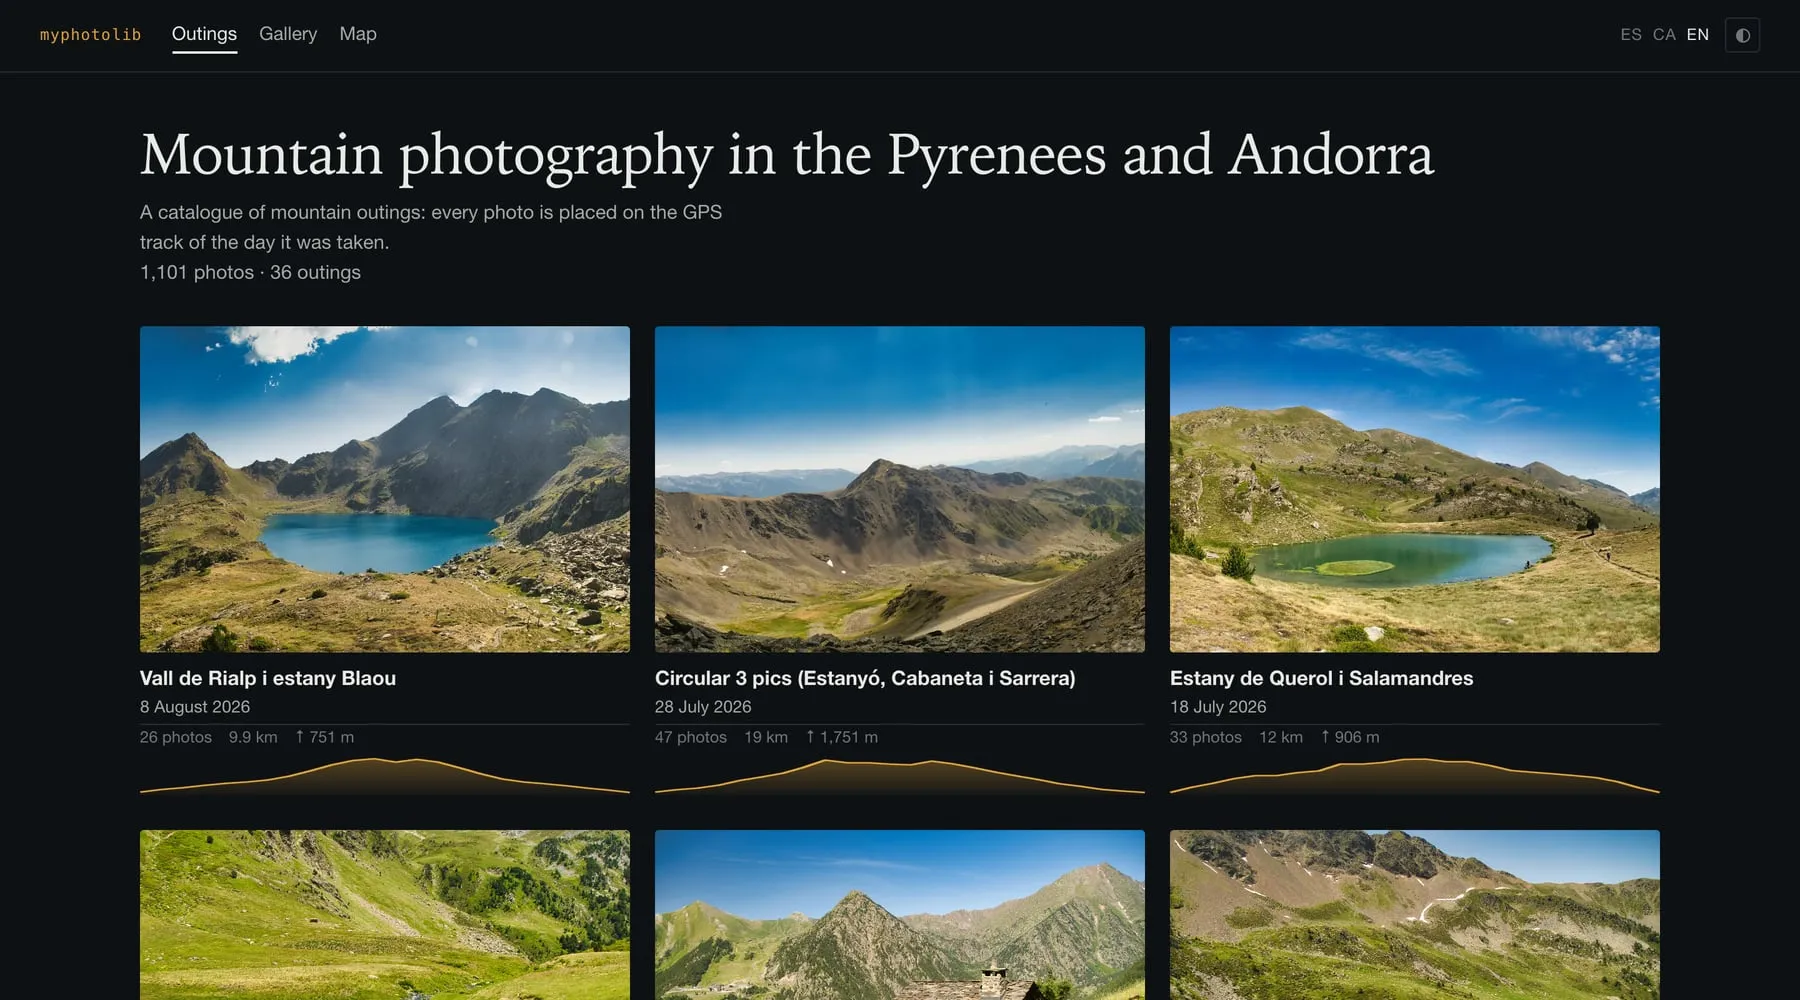
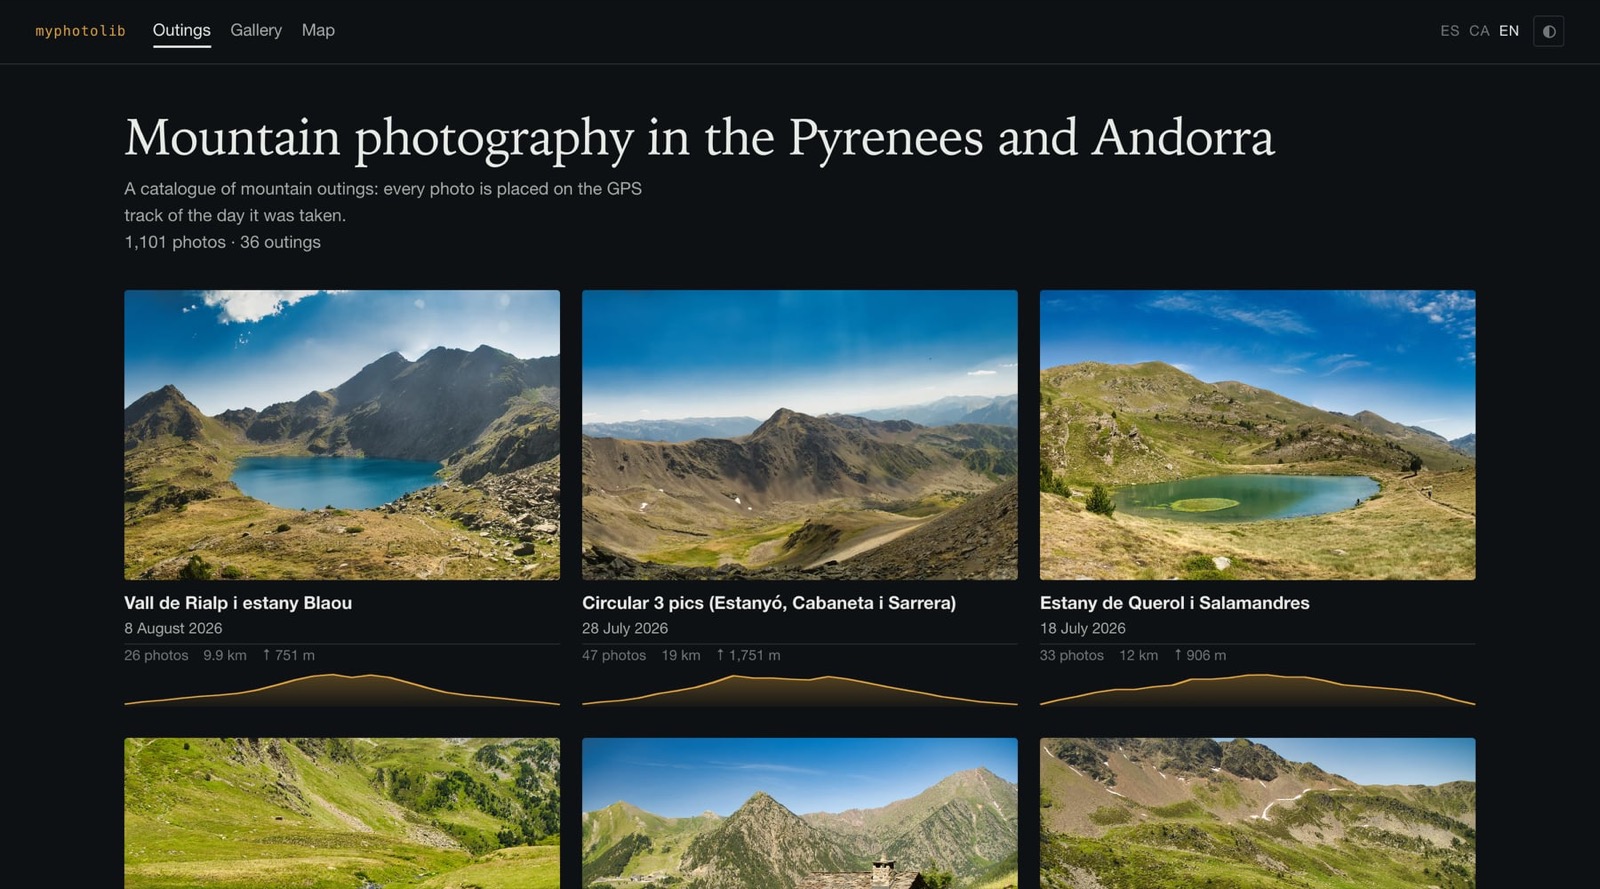
The result: 36 outings, 1,101 photos, every one of them placed on the GPS track of the day it was taken.
The itch
My library was 37 folders named YYYY-MM-DD Somewhere, holding 1,126 JPEGs developed
in Luminar Neo, plus 39 GPX tracks sitting in the same folders doing absolutely nothing.
The folders worked, in the sense that a shoebox works. What I couldn’t do was anything interesting:
- Show me every photo taken with the 60mm macro. Or above ISO 3200.
- Where exactly was this lake? I remember the light, not the coordinates.
- Which of these 45 frames did I shoot while standing still, catching my breath?
And the annoying part: the answer to all of it was already on disk. Every photo has an EXIF timestamp. Every track point has a timestamp too. That’s a join key. A photo taken at 10:21:44 belongs between the two track points that bracket 10:21:44, and once you can interpolate a position, everything else — the map, the elevation profile, the distance along the route — falls out for free.
That idea took ten minutes. The remaining three weeks were the data disagreeing with me.
Surprise one: time is not one column
My first attempt placed a photo an hour away from where I took it, consistently, and only sometimes.
The camera’s clock is set to UTC+1 and never observes daylight saving. Andorra in July is
at UTC+02:00. So a photo whose EXIF reads 09:21:44 was actually taken at 10:21:44 in
lived time, which is the time the watch was writing into the track. There are three distinct
temporal columns here — the local time on the camera, the UTC offset, and the resulting
instant — and they cannot be collapsed into one.
Worse, the offset isn’t a property of the library. It’s a property of each photo: my audit
found 1,043 files at +01:00 and 10 at +02:00, because at some point the camera’s zone got
changed. Assume one offset per outing and those ten photos land an hour off, silently.
Two tempting shortcuts are both wrong:
mdlson macOS ignores the EXIF offset, which produces a beautiful false positive: it looks exactly like a one-hour clock drift.- The file’s
mtimeis useless, because Luminar rewrites it on export.
The only valid source is DateTimeOriginal + OffsetTimeOriginal, read per file. That is
now rule number three in the project’s list of things not to revert.
Surprise two: the EXIF lies about the picture’s shape
I read image dimensions from EXIF, because of course you do. Then the justified grid on the gallery page broke — and it broke specifically on my best frames.
PixelXDimension is simply absent from some of my panoramas — five of them in one outing,
as it happens. The biggest stitch in the library is 17095×4332 pixels, 74 megapixels, and with
no EXIF dimensions the fallback treated it as a regular 4:3 frame. A 4:1 panorama laid out as
4:3 destroys a justified row.
So the indexer now parses the JPEG’s SOF marker directly: the width and height the decoder
itself will use, straight out of the bitstream. It also means panorama detection is done by
aspect ratio, never by filename — one of mine is called Pano01.jpeg and another
P6290066_PANORAMA.jpeg, and the ratio doesn’t care.
Those same panoramas are ~300 MB each once decompressed, which is why the derivative
pipeline runs sharp.concurrency(1) with a concurrency limit of 8, dropped to 2 for the
extreme aspect ratios. libvips already threads inside each operation; oversubscribing made
the whole batch slower.
Surprise three: a degree is not a distance
To draw 6,000 track points in a browser you simplify them. I reached for Ramer–Douglas–Peucker with a tolerance of “a few meters” and got a track that was mush in one axis and untouched in the other.
@turf/simplify works in whatever space you hand it. Hand it degrees and your tolerance is
in degrees — and at 42°N one degree of longitude is 82.6 km while one degree of latitude is
111 km. So the simplification is anisotropic by a factor of 1.35, which is exactly what a
“straightened” mountain track looks like.
The fix is to project to local meters (an equirectangular ENU frame), simplify there, and project back. Which leads to the second geodesy rule: the project uses two projections on purpose. ENU meters to measure and simplify, Web Mercator to draw on tiles. At this latitude Mercator stretches the vertical axis by 36%; mixing the two moves a track hundreds of meters sideways, and it does it without any error at all.
Surprise four: my elevation gain was 12% too generous
Summing every positive altitude delta over a track is the obvious way to compute ascent, and it is wrong. The median altitude change between two consecutive points on my Garmin’s log is 0.40 m — that’s not climbing, that’s the barometric altimeter breathing. Integrate the noise over 6,000 points and you invent hundreds of meters.
Adding 2 m of hysteresis — only count a climb once it’s committed to 2 m — brought my numbers in line with what the Garmin itself reports, which is the only reference I trust here. Across the whole library it’s 23,725 m of filtered ascent against 26,918 m raw: the naive method was 12% high. The database stores both figures, because “which one is real” is a question the data can’t answer on its own.
Curation is a data problem wearing a UI
Automation gets you to about 94%. It cannot pick a cover photo, and it cannot know that the folder labeled one day contains photos from three.
So the second piece is a local app — Hono, Vite, Svelte 5 — that runs on my laptop and does four things: cull, rate, title, and fix geolocation by dragging a pin on a topo map.
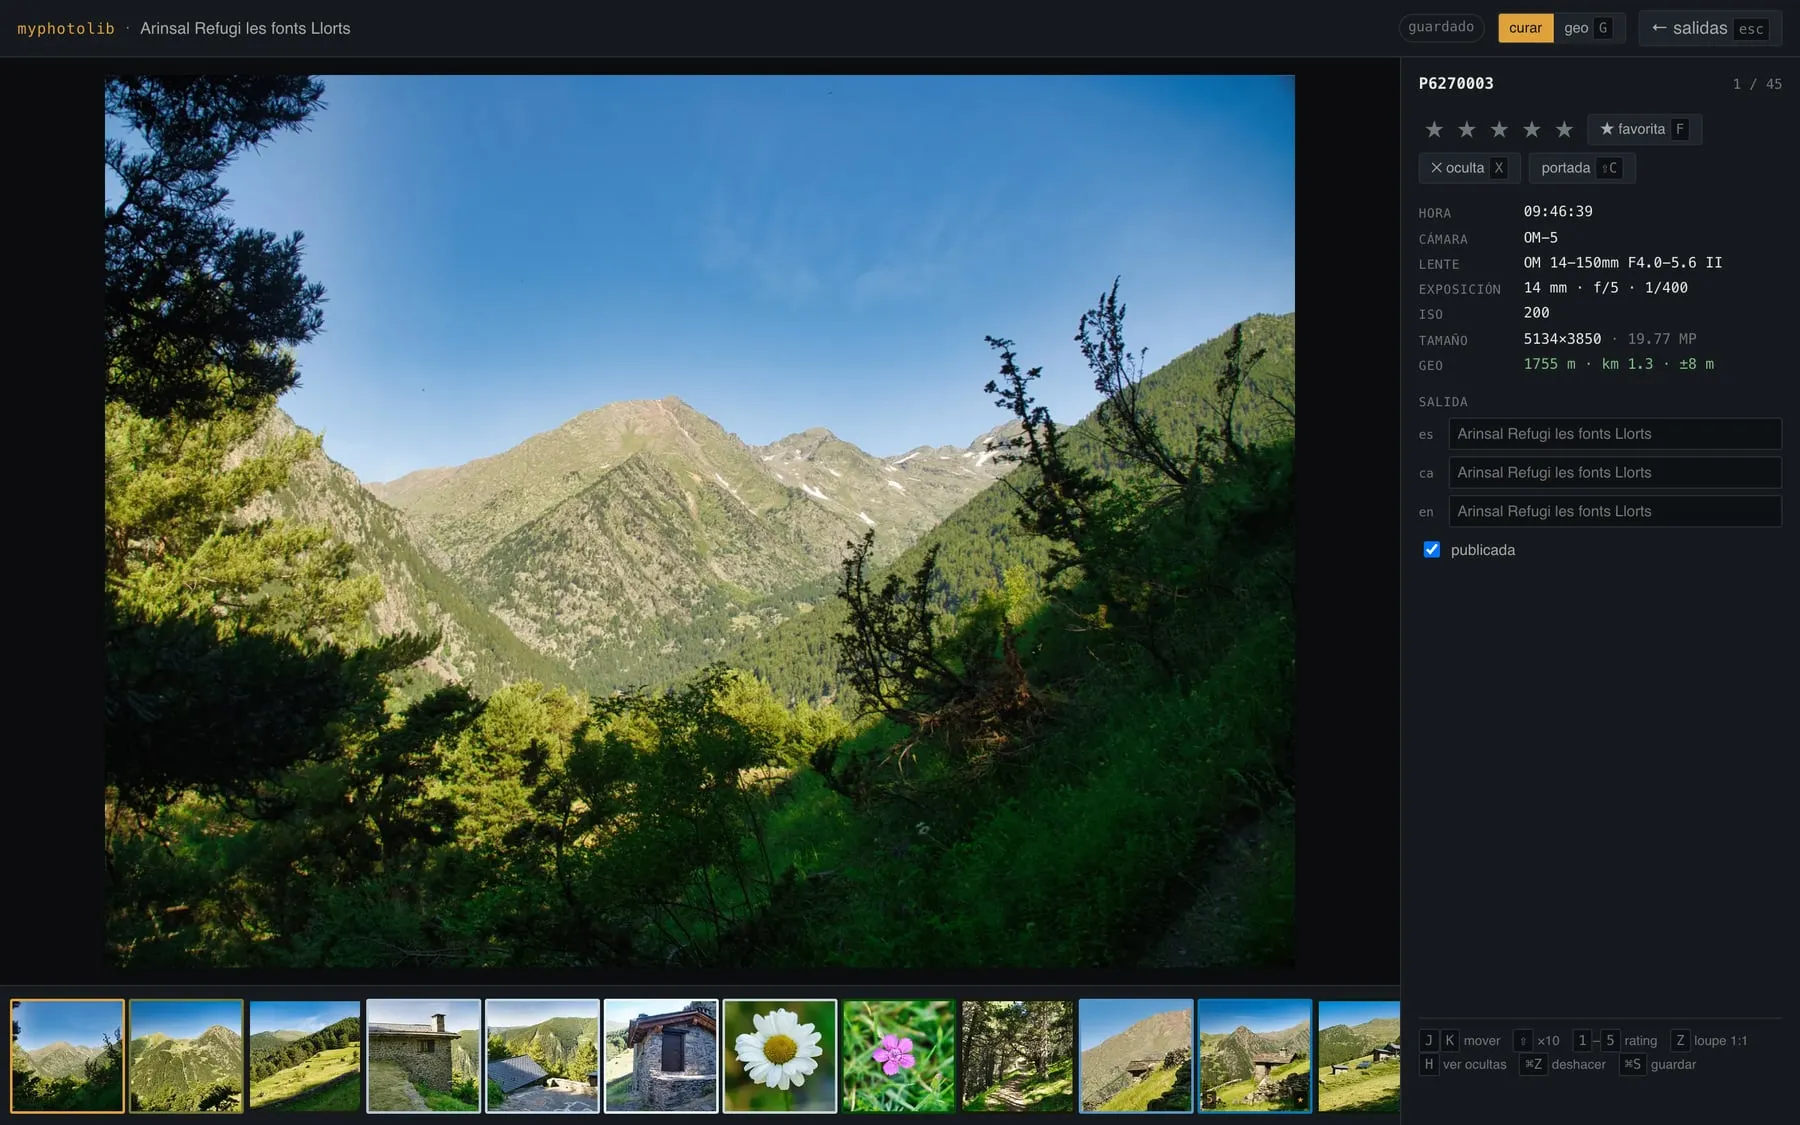
The culling view. Keyboard-first, because 1,126 photos is a lot of mouse travel.
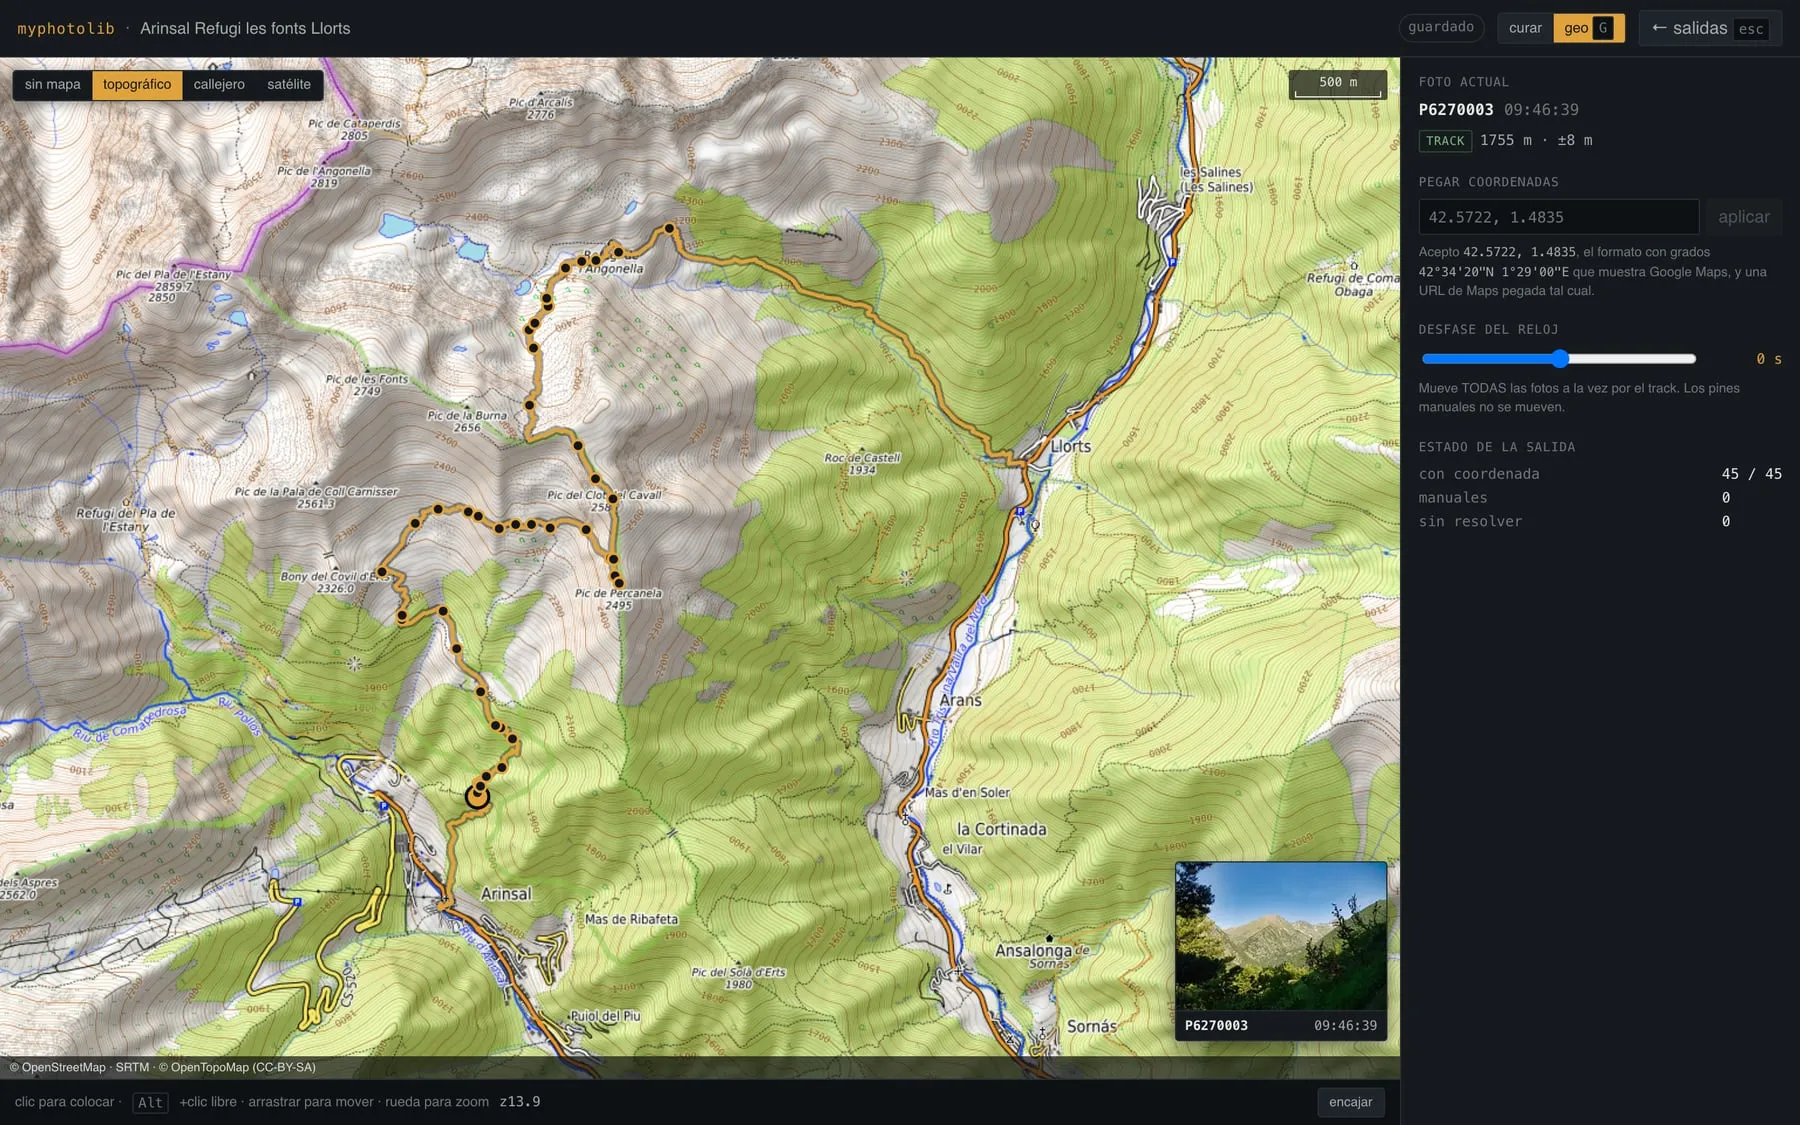
The geo view, where the 6% the algorithm can’t place gets placed by hand.
The important decision here isn’t in the UI, it’s in the storage. Curation is written to YAML sidecar files in git, and each sidecar is a patch: it only records values that differ from what the pipeline derived. That keeps diffs at 100% signal — a commit shows “this photo became the cover”, not 1,100 lines of restated defaults.
Which matters, because I learned the hard way what the irreplaceable data actually is. The
JPEGs are in Dropbox and on a NAS. The SQLite index rebuilds from scratch in two seconds. But
an rm -rf during development took out seven hand-picked cover photos that hadn’t been
committed yet, and no amount of compute brings those back. The rule now: curation/ gets
committed first, before anything else, and the project’s doctor command warns me if
anything is unbacked.
Some numbers are opinions
Once every photo had a position and a time, the outing page could show real statistics. This is where I learned the most uncomfortable lesson of the project: most of these figures are choices with a threshold, not measurements.
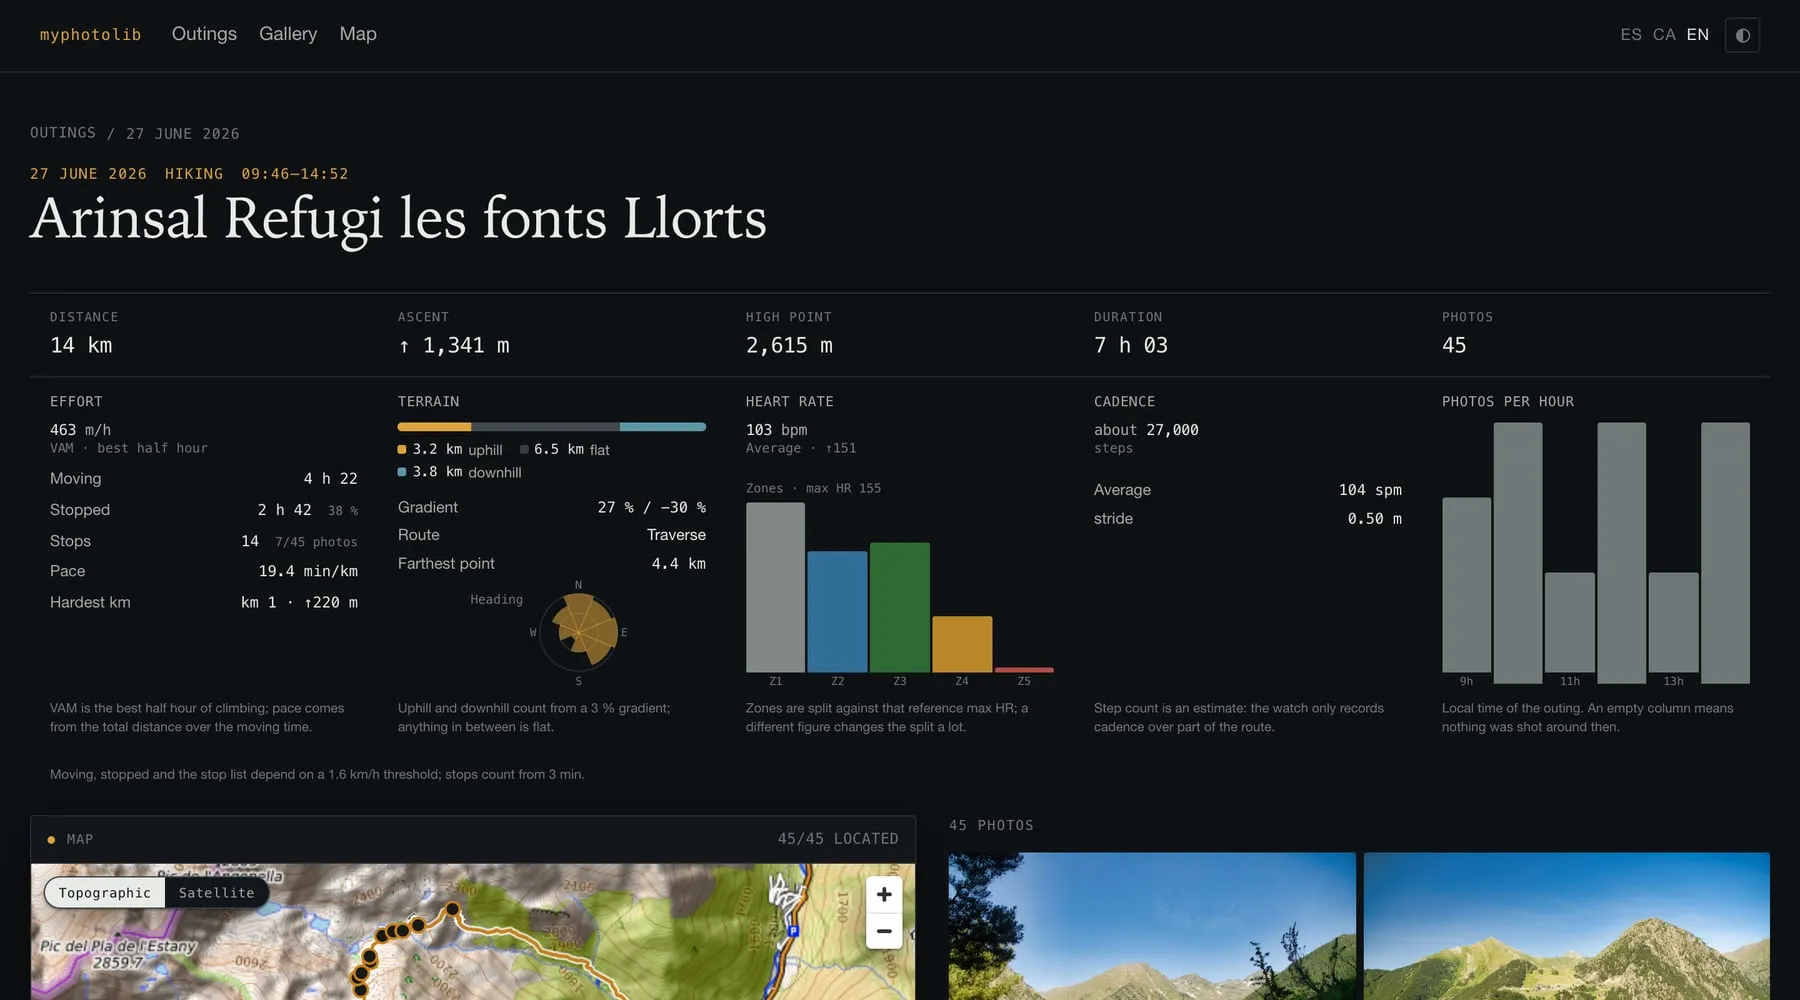
Take “photos taken while stopped”. On the Arinsal traverse, that number is 4% or 53%
depending on whether a stop must last 300 seconds or 45 — because photo stops are the short
ones. I settled on 180 s, but detectStops takes the threshold as a parameter specifically so
I could measure the sensitivity instead of arguing about it.
Heart-rate zones were worse. They’re computed against a maximum heart rate that the GPX does not contain, so it comes from my config file. The same outing, same data:
| Assumed max HR | Time in Z3 | Z4 | Z5 |
|---|---|---|---|
| 185 | 21 min | — | — |
| 170 | 1h33 | — | — |
| 155 (the real one) | 1h54 | 49 min | 4 min |
Zones that don’t publish their reference mean nothing at all, so the page prints “max HR 155” right next to the chart.
The same shape of problem, over and over:
- VAM (vertical ascent rate): the same day yields 184, 307, 476 or 463 m/h depending on the window you average over — a factor of 2.6. The site publishes the best 30-minute window and says so.
- Pace uses total distance, not “moving” distance. The filtered figure is more correct and it doesn’t match the two numbers next to it: the page says 13.5 km and 4h22, and a reader who divides them expects 19.4 min/km, not 23.8. A number you can’t verify against its neighbors reads as a bug even when it’s better.
- The heading rose only appears on traverses. On a loop the bearings cancel by construction and the distribution comes out almost uniform — pure geometry, zero information. On the Arinsal traverse, 76% of the route heads into the N–E quadrant, and that’s worth drawing.
- Cadence in the GPX is per leg. Publishing
ns3:cadas-is gives you exactly half the real step rate. My tracks average 52 → 104 steps/min, which is what the watch says.
Then it had to be a website
The public site is Astro with a few Svelte islands, statically built, with a performance budget I actually enforce.
The whole library ships to the browser as a columnar index: parallel arrays plus dictionaries instead of 1,101 JSON objects. It’s 90 KB of JSON that gzips to 33.7 KB, and it’s what makes the gallery’s eleven faceted filters — outing, year, camera, lens, ISO, aperture, shutter, focal length, orientation, favorites, and whether the photo is located — instant, with live counts, entirely client-side.
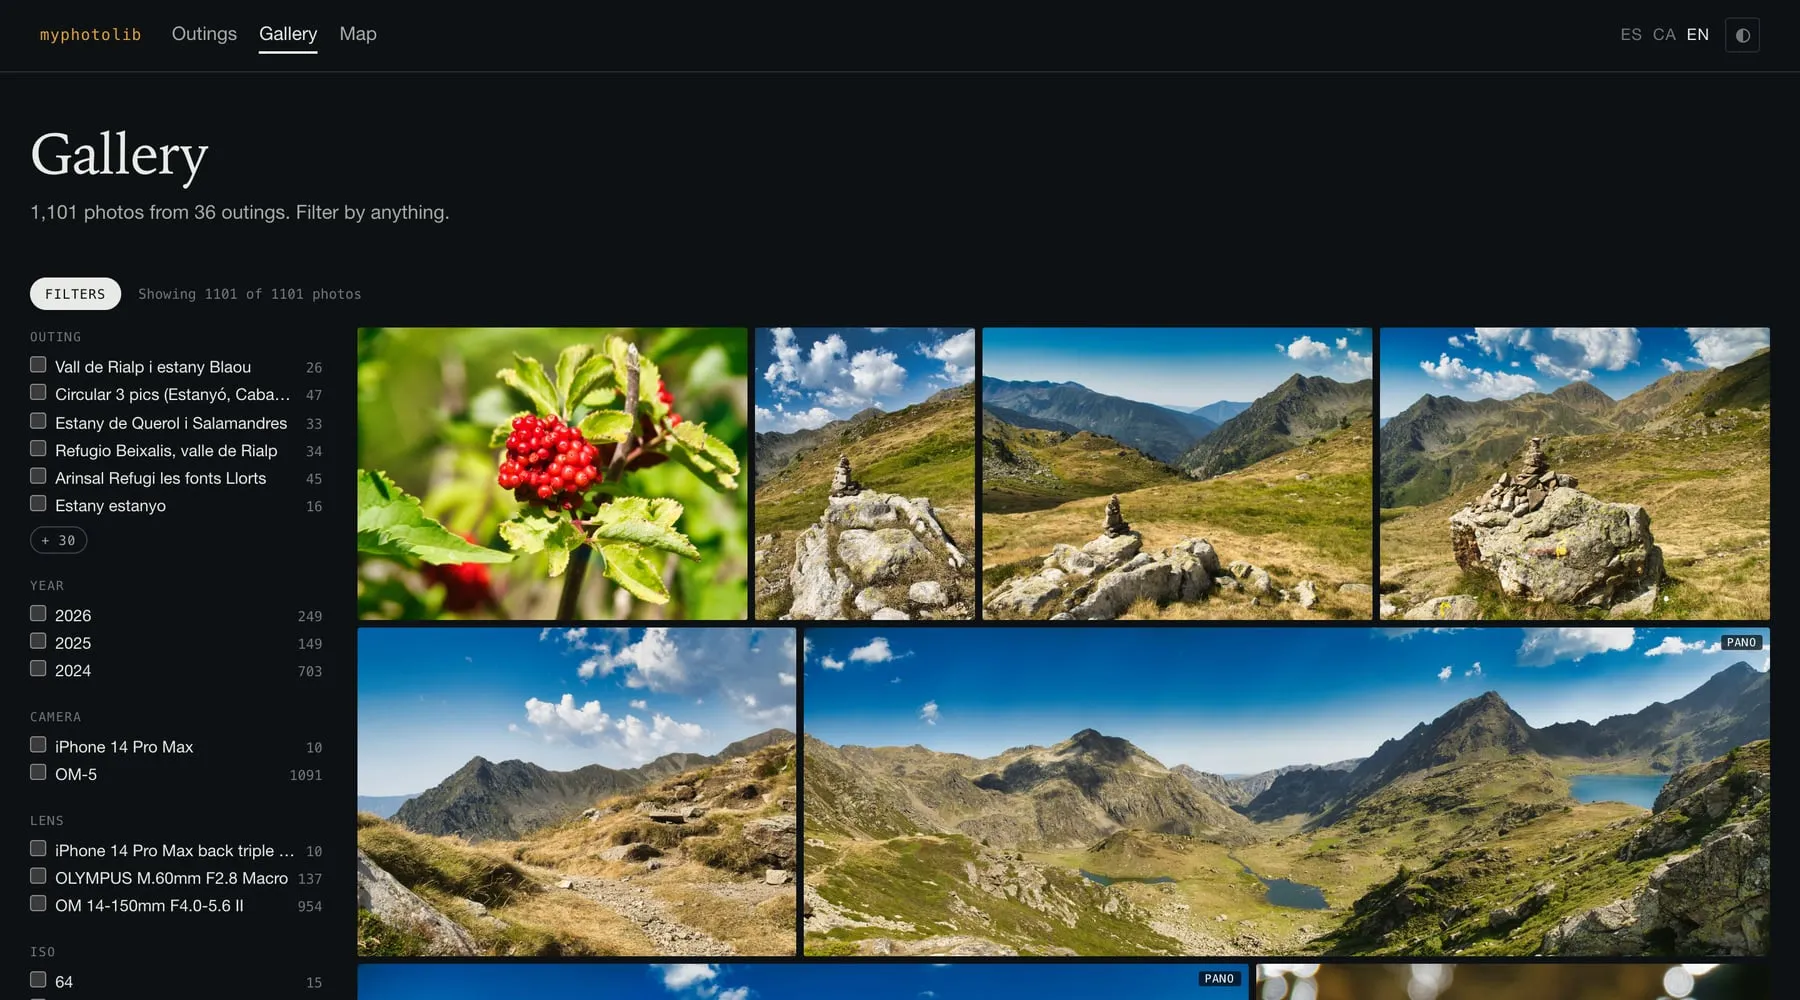
1,101 photos, eleven facets, filtered in the browser against a 33.7 KB index.
The budgets, measured on the real build: the home page ships 0 KB of bundled JavaScript.
The gallery costs 26 KB plus the index. MapLibre’s 283 KB loads on the map page and only
there. A full rebuild of the catalog takes 0.8 seconds, which means my edit loop after a
curation session is: commit, build, reload.
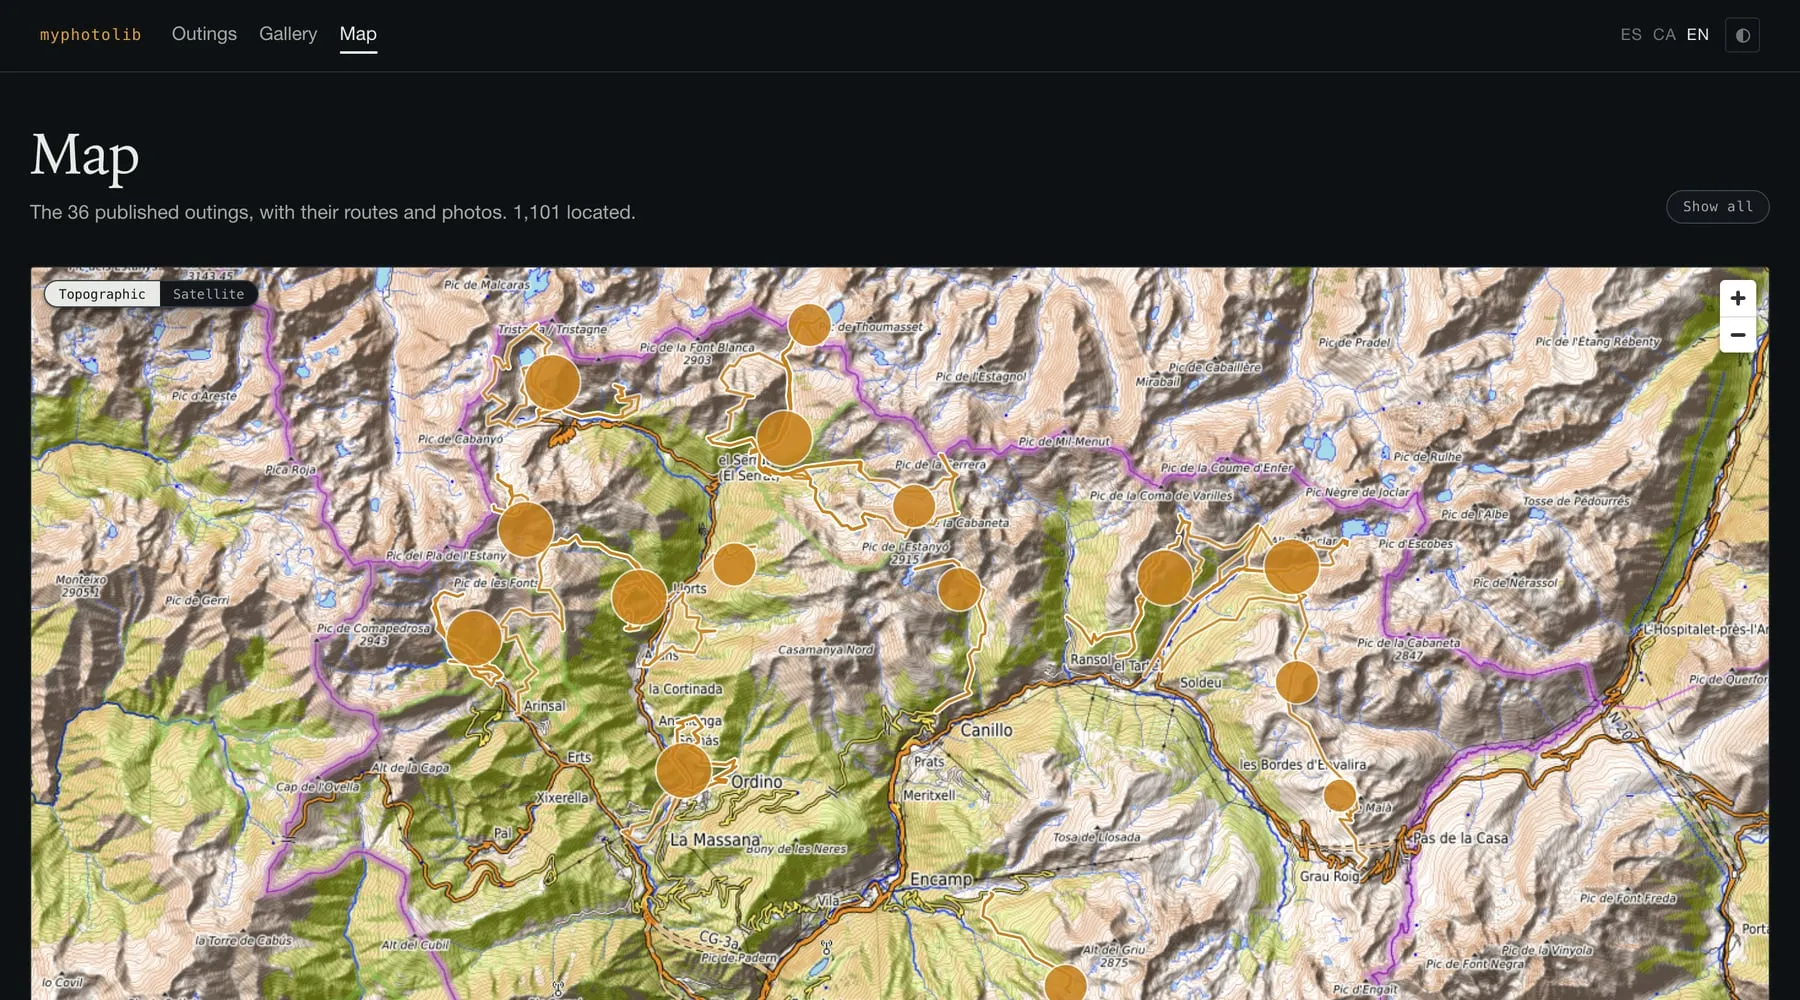
On the map, clicking a cluster does not zoom in. Everybody’s example code calls
getClusterExpansionZoom, and on my data that produced a dead interface: I measured it on a
circle of 143 photos and the first click moved the zoom from 10.98 to 11.00. Five clicks to
reach a photo. Now a cluster whose photos all belong to one outing navigates straight to that
outing, and a mixed one frames its photos — two clicks, worst case.
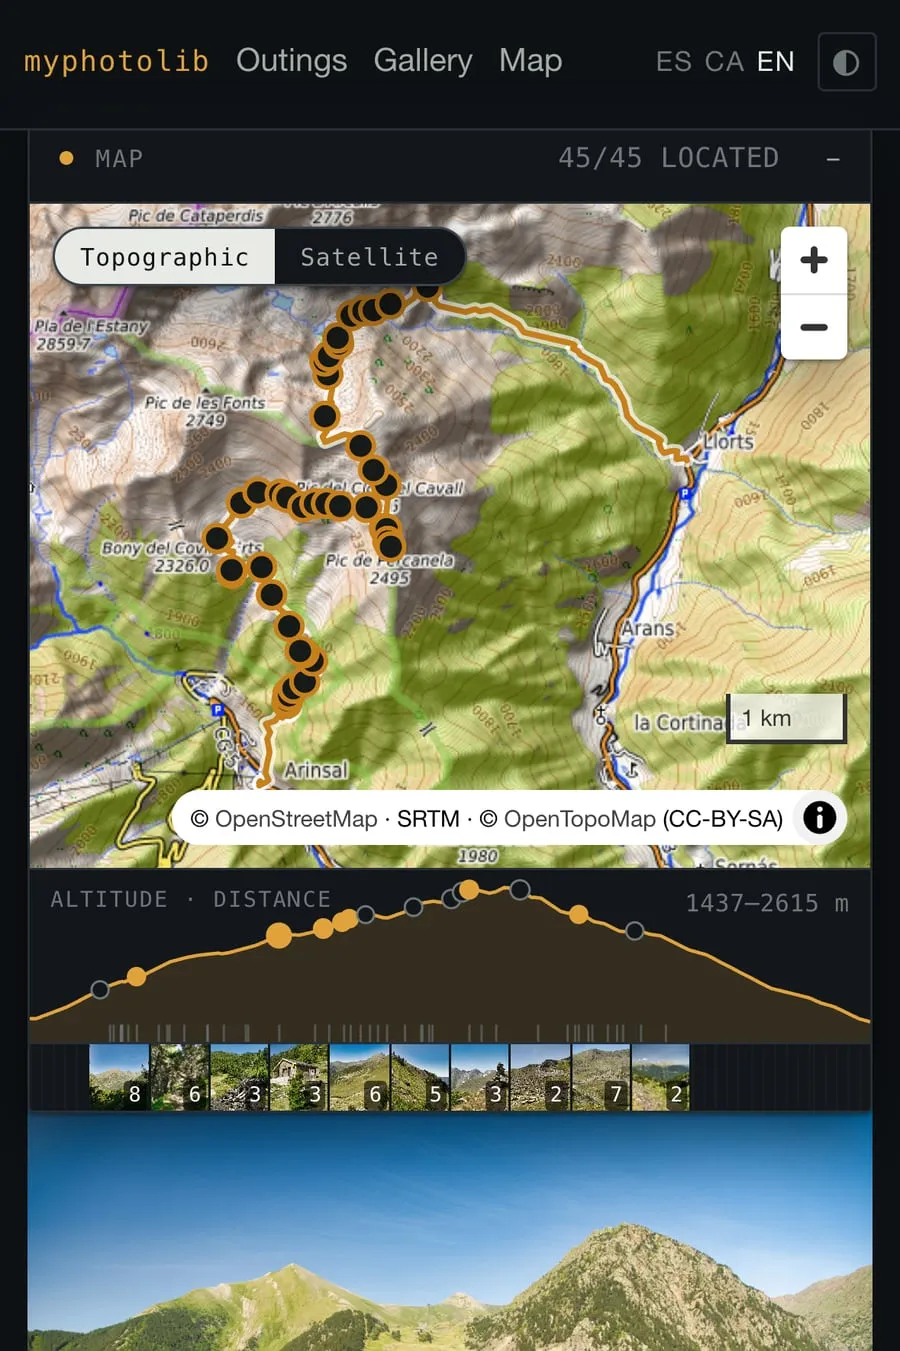
The outing page is the one I actually use: a sticky panel with the map, the elevation profile and a filmstrip, next to a justified grid of the day’s photos, all three synchronized. Hover a photo, its pin lights up on the map and its marker on the profile. Hover a stop on the profile and the grid dims everything not taken during that stop.
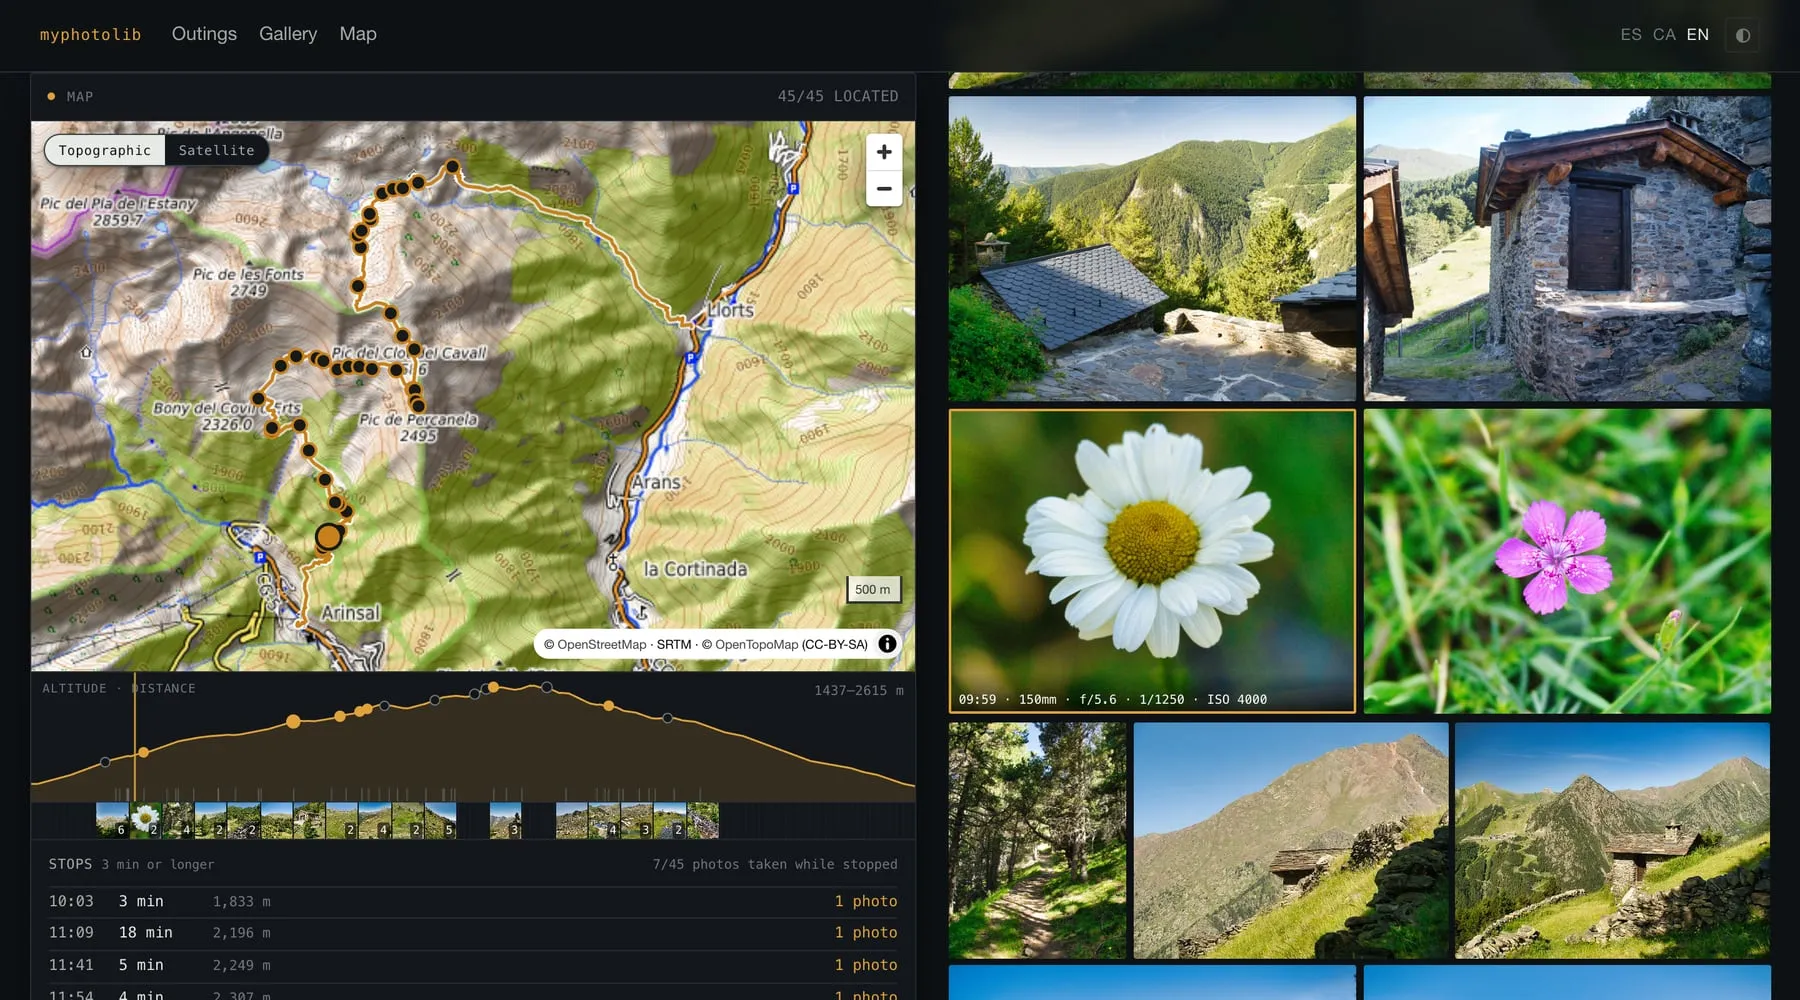
Grid → pin → profile, all three following one hover.
The bugs you only find with a browser that’s actually painting
Here’s the part I’d tell any developer building something visual.
MapLibre depends entirely on requestAnimationFrame, and requestAnimationFrame does not
fire in a hidden tab. Every headless check I wrote was passing against a map that had never
painted a pixel. So the project has a verification script that launches Chromium with a real
visible window and asserts on the computed style and on queryRenderedFeatures() — what the
GPU actually drew — rather than on the DOM.
It found things no unit test could:
- A lightbox that opened with zero slides. PhotoSwipe’s
loadAndOpen(index, dataSource)wants the array loose; I’d wrapped it in an object. No error, no warning — just a black overlay with a working counter and arrows over three empty slides. It shipped like that. - CSS that the compiler deleted. Svelte prunes selectors it can’t find in the markup, and
my highlight attribute is set imperatively via
setAttribute(deliberately, outside the reactive graph). So the attribute was applied correctly and the rule didn’t exist. The only clue was oneUnused CSS selectorwarning lost in Vite’s startup noise. - A highlight that was dead on arrival for exactly one photo. The map hydrates late; the
grid positions its cells with JavaScript, so a cell can slide under a stationary cursor and
fire
mouseenterbefore the map exists. The map subscribes, gets the id, has no layers yet, discards it. Then the visitor moves onto that same cell, the store value doesn’t change, and nanostores doesn’t notify. Anything that hydrates late has to read the store’s current value, not just subscribe to it. - A tile that never arrives is not an error — it’s a
200with no body. My map worked on desktop and showed dark bands on an iPhone. The cause was not iOS compositing. Over HTTP/2 the tile server was sending headers in 0.1 s and then never sending the body; MapLibre sets no timeout and never retries, so the tile staysloadingforever. And becauseSourceCache.loaded()requires every tile to be either loaded or errored, one hung tile means the map’sloadevent never fires at all. Why only mobile? The container’s aspect ratio decides which zoomfitBoundspicks, the zoom decides which tile pyramid gets requested, and at z11 a third of the tiles in frame hung versus 8% at z12. The fix is a custom tile protocol with a 5-second deadline — covering the body, not just the headers — and three retries before deliberately throwing, because an errored tile at least counts as resolved.
On building it in three weeks
I paired with Claude Code for most of this, and the honest split is worth writing down. It was genuinely fast at the parts that are hard-but-known: the columnar codec, the RDP plumbing, the Svelte 5 runes, the Astro islands, 360 tests that keep the reference figures honest.
Every single problem in this post came from somewhere else — from measuring my own data and
finding it didn’t match the assumption. The camera’s timezone. The missing EXIF dimensions on
the frames I care about most. The altimeter noise. The tile that returns 200 and nothing else.
No model was going to guess those, and none of them showed up as an error message; they showed
up as plausible output that was wrong.
Which is why the repository’s most valuable file isn’t code. It’s a numbered list of 49 rules, each one a bug that cost me an afternoon, each with the measurement that proves it and a test that pins it. “Don’t revert this, and here’s why.”
Where it stands
37 outings indexed, 36 published, 1,101 photos, every one placed. 93.9% of the full library geolocated automatically; the remaining 6% are folders with photos from other days mixed in — a decision I have to make, not an algorithm I have to write.
Next up: my own PMTiles basemap so I stop depending on someone else’s tile server, OG cards rendered with satori, AVIF, RSS. And the part no code will fix — 31 of those outings still don’t have a title I wrote myself.
The whole thing is here: myphotolib.netlify.app
Shot on an OM System OM-5, mostly with the 14-150mm. Tracks from a Garmin. Andorra and the Pyrenees, 2024–2026.

Resistance is futile.